
Executive Summary
Countries rich in minerals and energy are leaving a massive share of that wealth undeveloped, not for lack of resources, but for lack of a faithful, consolidated view of how their minerals, water and energy depend on each other and what each investment is really worth.
Three decisions that determine a country’s future are taken in three separate worlds. Ministries and utilities plan energy supply. Mining agencies and companies plan exploration and extraction for export. Investors and lenders judge infrastructure finance with their own assumptions. Each world plans with simplified models built on averages, which erase the very patterns that decide success: a dry year, a price collapse, a lower ore grade, a delayed line.
The result is predictable:
- Mines wait for power that was never planned.
- Power plants are built for demand that never arrives.
- Projects never reach financial close because no one can show investors the range of outcomes they will face.
- Value that exists on paper stays frozen in the ground.
Knar proposes a different foundation for these decisions: one national model of resources and energy, assembled from Industrial Digital Assets (executable models of each mine, deposit, water basin, plant, line, port and demand center) and integrated into an Integrated Decision Support System (iDSS). The model keeps the detail that averages destroy, and shows decision makers:
- Where supply of energy and water is constrained, and what that constraint costs every region and every project.
- Which mineral and energy developments are viable, under which prices, grades and climate conditions.
- What each investment, or combination of investments, changes in risk, cost and value across the whole country.
- The range of returns an investor can expect, including in bad years, and where the money to build it can come from.
National oil, mining and energy companies, and the governments that oversee them, should no longer allocate national wealth on spreadsheets and the pressures of the moment.
Part 1: The Value Countries Leave Locked
The wealth at stake is measured in decades of development, not only in dollars: every year a viable deposit, line or plant waits is a year of exports, jobs, tax revenue and energy security the country does not get back. The evidence that minerals, water and energy are one problem is already visible.
1.1 Energy Decides Whether Mines Produce
In 2024 a historic drought cut the hydropower that supplies about 85% of the electricity of one copper-exporting country.
- Generation fell from about 3,777 MW of normal capacity to 1,019 MW.
- Mining accounts for about half of national power demand and about 70% of export earnings.
- Mines were told 40% of their normal supply was subject to emergency restrictions, and turned to more expensive imported power.
One climate event in one energy source hit the country’s main source of foreign income.
1.2 Resources Decide How Much Energy and Water a Country Needs
The national copper agency of a major producing country projects that mining’s electricity demand will rise much faster than its output, because falling ore grades require more energy and water per tonne.
- Electricity demand: +31.4% in ten years, from 26.0 TWh (2023) to 34.2 TWh (2034).
- Copper output over the same period: +20.7%.
- Pumping and desalinating seawater alone is expected to use about one-fifth of the industry’s energy by 2034.
1.3 Time Is the Scarcest Resource
Major mines that started operating between 2010 and 2019 took more than 16 years on average from discovery to first production. A planning error that delays the power line, the water supply or the financing adds years to a timeline that is already long.
1.4 The Investment Must Come From Private Capital
About 600 million people in one large region of the world lack electricity. Leading multilateral development banks aim to connect 300 million of them by 2030, and state that massive private investment is crucial to get there. Private capital moves only when it can see risk and return clearly.
1.5 Estimates Built on Averages Fail Systematically
In a study of 258 transport infrastructure projects, about 90% exceeded their cost estimates, by 28% on average.
A country can hold world-class deposits, water and renewable potential and still fail to develop them, because no one can show, in one consistent picture, what it takes to unlock them and what they are truly worth.
Part 2: Three Worlds That Never Meet
The first barrier is separation: the decisions that unlock a country’s resources are made by different institutions, with different models, on different timelines.
2.1 Who Decides, and What They Cannot See
| World | Who decides | What they plan | What they cannot see |
|---|---|---|---|
| Energy | Energy ministry, utilities, national oil and gas companies | Power, gas and fuel supply to meet forecast demand | The new demand a mining district would create; the water that hydro shares with mines and cities |
| Resources and exports | Mining ministry, national mining company, concession holders | Exploration, extraction and export of minerals, oil and gas | Whether power, water and transport will exist when the project needs them, and at what cost |
| Investment and finance | Ministry of finance, development banks, private investors and lenders | Which projects to fund, and on what terms | The real range of returns, because no one hands them a model that shows it |
2.2 How Each World Can Be Competent and Still Fail the Country
- A mining district is approved without the transmission line it needs, so the deposit waits.
- A power plant is sized for average demand; a new mine or a dry year makes it too small, or a cancelled project makes it too big.
- Hydro, irrigation, cities and mines are promised the same water.
- Gas is exported under long-term contracts that later leave the country short of fuel for its own power plants.
- An investment that would serve both a mine and a region with no energy access is never proposed, because neither world sees the shared value.
None of this is a failure of effort. It is the absence of one place where minerals, water, energy, exports and money are seen together, with their real dependencies.
Part 3: Models That Average Away the Truth
The second barrier is fidelity: even where planning exists, it usually runs on spreadsheet models that replace real behavior with averages, and an average of these systems is not a description of them.
3.1 The Problem Is Not Excel
The problem is not the tool. It is that these systems have so many interacting, uncertain variables, and are so probabilistic by nature, that a single expected value hides exactly what matters.
3.2 What Averages Hide
Coincidences
A dry year, a fuel-price spike and an outage on an aging line do not happen “on average”. They happen together, and that is when a country runs short.
Thresholds
A deposit is profitable above a certain ore grade and a certain price, and worthless below them. An average grade and an average price say nothing about how often the project crosses that line.
Bottlenecks
A network sized for average flow fails at peak flow. Seasonal demand, batch logistics and maintenance outages decide whether supply holds.
Degradation and Failure
Plants, pipelines, lines and tanks age and fail with a pattern, not at an average rate. Ignoring that pattern hides when capacity is lost.
Time
A project’s value depends on when it enters service relative to the constraint it solves. Averages over a planning horizon erase timing.
3.3 Precise Numbers That Are No Longer True
When these patterns are averaged out, the model still produces precise-looking numbers, but they are no longer true. A plan built on them can look robust while it is fragile, and a viable project can look marginal while it is sound. Integration does not cure this: connecting several simplified models only produces a larger simplified model.
What matters is the content of truth: a representation faithful enough to the physics, the operations, the uncertainty and the economics that decision makers can trust what it tells them.
Part 4: The Question Every Country Must Answer
Behind every master plan, concession round and financing request sits one question.
Are we steering our resource and energy investments wisely, and how would we know?
4.1 What Answering It Requires
Answering it in practice means answering, with evidence, questions like these:
- Where, when and why will energy or water supply fall short, and what will each shortfall cost each region and each project?
- Which deposits, plants and lines are worth developing, and in what order?
- From what ore grade of mineral X, and from what USD per barrel or per tonne, does this investment make economic sense?
- What is the range of profit if climate, prices or construction go against us, not only if they go as expected?
- If we export more gas or minerals, what does that do to domestic supply and to the money available for infrastructure?
- Which single investment unlocks the most value across energy, minerals and regions at once?
A wrong answer is not an academic error. It means capital spent where it does not relieve the real constraint, years lost on projects that never close, and a country less able to sustain itself.
Part 5: One National Model of Resources and Energy
The answer is a single executable model of the country’s resources and energy, built piece by piece from faithful models of each asset, and integrated so that every decision is judged against the whole.
5.1 What the Model Represents
The country is a network of regions connected by infrastructure.
| Element | What it is | Examples |
|---|---|---|
| Resources | What the country holds in the ground and in its basins | Mineral deposits, oil and gas fields, water basins, solar, wind, hydro and geothermal potential |
| Production and conversion | Where resources become products or another form of energy | Mines and concentrators, refineries, power plants, desalination, electrolyzers, gas processing |
| Links and storage | How products, energy and water move and are held | Transmission lines, pipelines, aqueducts, rail, roads, ports, tanks, reservoirs, batteries |
| Domestic sinks | Where energy and water are consumed | Cities, industrial zones and the mines themselves, defined by the services they need (transport, heat, power, process water) |
| Export sinks | Where products leave the country and bring revenue back | Mineral, oil, gas and power exports, under price and contract terms |
5.2 Two Ways Energy Is Replaced
Conversion
- •Happens before the energy reaches the user, in a physical asset.
- •Example: gas becomes electricity in a power plant.
- •Has its own capacity, efficiency, reliability and cost.
Switching
- •Happens at the point of use: the service stays, the energy that serves it changes.
- •Example: transport moves from diesel to gas and electricity as fleets change.
- •Changes demand on several networks at once.
A mine is both a source of export value and a large sink of energy and water. That is precisely why minerals and energy cannot be planned apart.
5.3 Industrial Digital Assets: The Building Blocks
Each element is modeled as an Industrial Digital Asset (IDA): an executable model that links its engineering behavior to its reliability, operations and economics, with its own uncertainty.
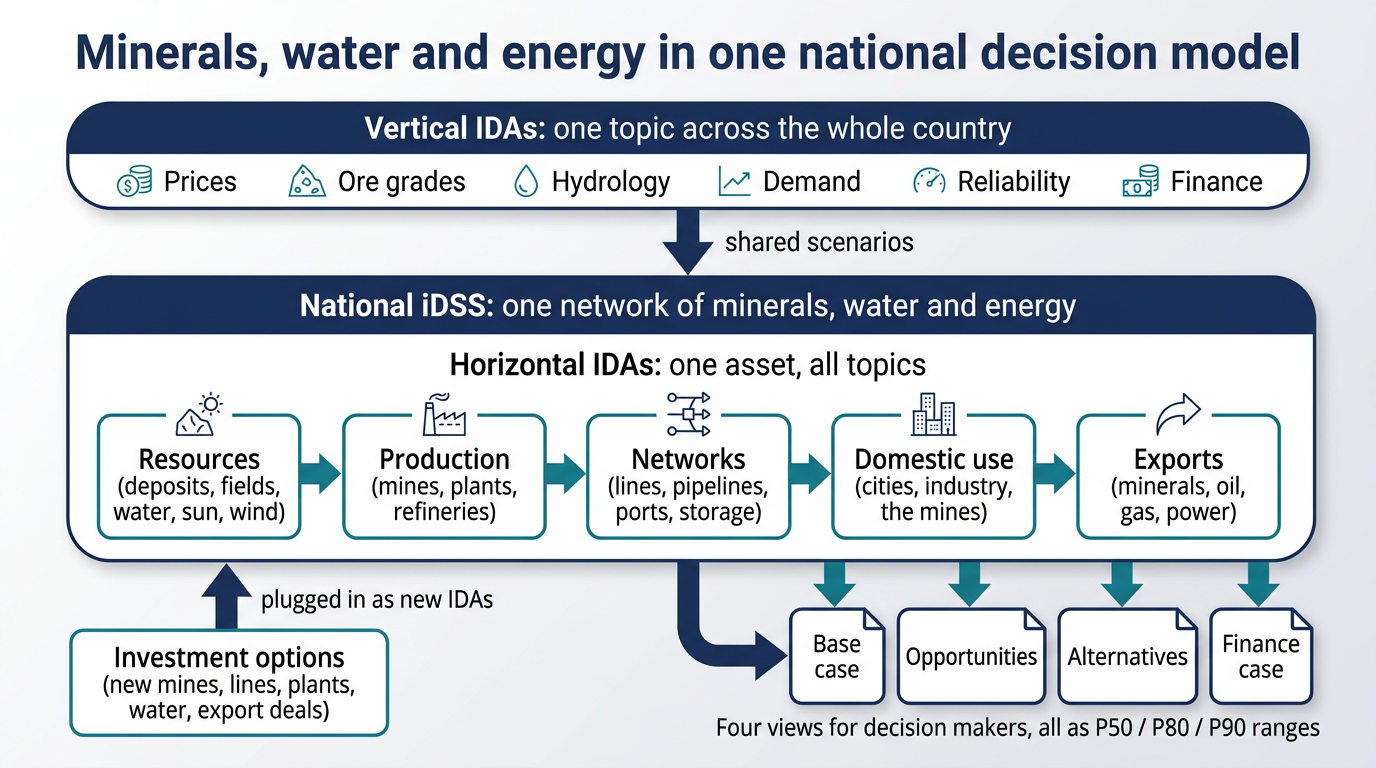
Horizontal IDAs
- •One physical element, all topics.
- •Examples: a deposit and its mine, a hydro plant, a transmission corridor, a water basin, an export port, a city’s demand.
Vertical IDAs
- •One topic, across the whole country.
- •Examples: mineral and energy prices, climate and hydrology, demand growth, reliability and integrity of assets, financing and fiscal terms, regulation.
5.4 The iDSS: One View of the Whole
The IDAs are integrated into an Integrated Decision Support System. The integration adds what no single model provides:
- One network, where shortages propagate across energy, water and minerals.
- One set of scenarios, applied consistently to every asset.
- One optimizer for the whole system.
- Common measures of risk, cost and value at every region and project.
5.5 Investment Options Plug In
A new mine, a solar park, a transmission line, a desalination plant, a fleet-electrification program or an export contract is an alternative with a technical scope and a cost. It enters the iDSS as new or modified IDAs, and the model shows what it changes everywhere, not only where it is built.
Part 6: High-Level Architecture
The national iDSS is built in seven layers, a proven structure that separates faithful representation, uncertainty, optimization, decision and governance, so each can be trusted and improved on its own.
6.1 The Model at a Glance
Minerals, water and energy in one national decision model
6.2 The Seven Layers
| Layer | What it does | What it holds for minerals, water and energy |
|---|---|---|
| 1. Network representation | Models every resource, production and conversion node, link, storage point and sink, with capacities and flow rules | One national network: deposits, mines, basins, plants, lines, pipelines, ports, cities, export points |
| 2. Assets, alternatives and behavior | Holds the IDAs; generates scenarios of new capacity, new routes and new projects; injects uncertainty | Horizontal IDAs per asset; vertical IDAs for prices, grades, climate and hydrology, demand, failures, financing |
| 3. Simulation and optimization | Simulates flows across many futures; finds bottlenecks; optimizes dispatch, logistics, inventory and investment | Monte Carlo over 20+ years; mixed-integer and linear optimization; discrete-event logistics; sensitivity |
| 4. Decision | Compares scenarios, evaluates trade-offs, ranks alternatives and portfolios, recommends sequencing | Investment options compared against the base case at every region and project |
| 5. Value and economics | Turns physical results into risk, cost, revenue and return, as ranges | P50 / P80 / P90 of supply risk, delivered cost, project NPV, export revenue, fiscal take; viability thresholds |
| 6. Visualization and data | National maps and dashboards; connections to existing data sources | One view for ministries, national companies and investors, fed by utilities, mining registries, hydrological and statistics offices |
| 7. Governance and compliance | Access by role, audit trail of every assumption and decision, coding of regulations | Energy, mining, water, environmental and fiscal rules applied as constraints in every scenario |
6.3 Methods Behind the Layers
- Reliability, availability and maintainability (RAM) models and failure distributions for every asset.
- Integrity and degradation models for aging lines, pipelines and tanks.
- Monte Carlo simulation with consistent scenario draws across all IDAs.
- Network-flow, linear and mixed-integer optimization.
- PDEL® causal mapping, so every result can be traced to the assets and assumptions behind it.
- MiRO for portfolio and sequencing optimization.
- Model-based systems engineering (MBSE) to trace every method to a planning requirement.
Where commercial asset-analytics platforms already provide stable simulation and optimization engines, the iDSS uses them as its computational core. Effort goes into faithful IDAs and their integration, not into rebuilding solvers.
6.4 Modular by Design
A country does not need to model everything at once. It can start with the region, mineral or energy carrier where the constraint is most acute, prove value, and add IDAs over time without rebuilding what already works.
Part 7: What Decision Makers See
The iDSS gives each decision maker four views of the same national model, so the energy ministry, the mining company and the investor look at one consistent picture instead of three contradictory ones.
View 1: Base Case
Where, when and why is the country constrained today and over the horizon?
Saturated plants, lines, pipelines and basins by year; the cause of each shortfall (supply, transport, conversion, season, failure); supply risk and delivered cost for every region and project.
View 2: Opportunity Map
Which mineral and energy developments are viable, and under what conditions?
For each deposit or energy resource, the energy, water and transport it needs, whether they exist, and the price, grade and climate conditions under which it pays.
View 3: Alternatives and Portfolios
What does each investment, or combination, change across the country?
Change versus the base case in supply risk, cost and value at every region and project, including side effects elsewhere; ranking by value per dollar; the best sequence of investments.
View 4: Investment Case
Can this be financed, and what will investors and the state earn?
Ranges of NPV, revenue and fiscal take; viability thresholds; downside under adverse scenarios; where the money can come from.
Every result comes as a range (P50, P80, P90), not a single number, and every number can be traced to the assets, data and assumptions that produced it. That traceability is what lets a minister defend a decision, a board approve it and a lender finance it.
Part 8: The Economics: From Averages to Bankable Ranges
A mineral and energy strategy succeeds only when the money to build it arrives, and money arrives only when investors can see the full range of outcomes, including the bad ones.
Working with averages in systems this uncertain is financial suicide: it hides the downside that lenders will find anyway, and the upside that would justify the investment.
8.1 Thresholds Instead of Point Estimates
The iDSS answers the questions investors and boards actually ask:
- From what ore grade of mineral X does this mine pay, given the real cost of the energy and water it will need?
- From what USD per barrel, per tonne or per MWh does this investment make sense, and how often do prices fall below that level across simulated futures?
- What is the range of profit if a drought cuts hydropower, a key line fails or construction runs late?
- How much does a shared investment (a line, a port, a desalination plant) change the threshold of every project that depends on it?
8.2 Uncertainty No One Controls Is Estimated, Not Ignored
Prices, climate and international markets cannot be managed, but their effect on returns can be bounded. Each vertical IDA carries its own distribution: price paths, hydrology, grades, failure rates, construction time and financing terms. The iDSS combines them in every simulated future, so coincidences such as a dry year with a price collapse appear as they do in reality.
8.3 Where the Money Comes From
Because exports and domestic supply live in the same model, the iDSS shows how value flows:
- Export revenue and fiscal take from minerals, oil, gas or power, and what they can finance.
- Infrastructure whose cost can be shared between a mining project and the region it crosses, improving the case for both.
- The trade-off between exporting a resource and using it at home.
- The risk profile each type of investor (state, development bank, private lender, equity) would carry.
8.4 From “Interesting” to “Bankable”
A financing request that states its viability thresholds, its downside range and the conditions under which it stops working is a request lenders can price. A request built on a single average case invites delay, renegotiation or refusal.
Many countries still wonder why their projects do not reach financial close, when the real reason is that they have never fully sized their own opportunities, limits and promises.
Part 9: Simplistic Approaches vs. Integrated Models
Oversimplified planning does not save money. It moves the cost to later, where it is larger: overbuilt or underbuilt infrastructure, stranded projects, and years lost waiting for decisions that cannot be defended.
9.1 What Each Shortcut Hides, and What It Costs
| Simplistic approach | What it hides | What it costs the country | What the integrated model does instead |
|---|---|---|---|
| Average demand, average prices, average climate | Coincidences, peaks and bad years | Shortages in the years that matter most; plants sized wrong | Simulates thousands of futures and reports P50 / P80 / P90 |
| One spreadsheet per sector | Dependencies between minerals, water and energy | Mines without power, hydro without water, exports that leave the country short | One network in which every dependency is explicit |
| Single NPV per project | The probability of loss and the thresholds of viability | Projects that never reach financial close; bad projects that do | Ranges of return and the grade, price and climate thresholds where value appears or disappears |
| Assets assumed always available | Aging, failure and degradation | Capacity that disappears when it is needed; unplanned replacement | RAM and integrity models for every asset |
| Projects evaluated one at a time | Side effects and shared value | Investments that solve one bottleneck and create another; shared infrastructure never proposed | Every alternative measured at every region and project |
| Static master plan, rebuilt every cycle | Learning and timing | Each plan starts from zero; investments arrive after the constraint | A living model updated as assets, data and prices change |
| Decisions driven by the urgency of the moment | The long-term consequences of the choice | Capital allocated by pressure, not by value | A traceable basis that any minister, board or lender can review |
Part 10: From Proven Work to a National Program
This concept extends an architecture Knar already designed for the strategic planning of a national liquid-fuels system, and it is delivered in three phases that put the methods before the software.
10.1 The Worked Example
A national fuels operator needed to replace spreadsheet master plans with a tool that could size and time investments over 20 years. Knar’s design:
- Modeled its import terminal, storage terminals, multiproduct pipelines and sales terminals as one flow network.
- Added ship logistics, inventory policy, batch sequencing and pipeline integrity.
- Generated scenarios for new capacity, terminals and routes.
- Measured every plan by its impact on the final consumer price.
The national mineral and energy iDSS applies the same logic to every resource, every form of energy, water and exports.
10.2 Implementation Pathway
Phase 1: Planning Methods
- •Catalog every analysis the country’s institutions use or need.
- •Define the national network, its regions and the first IDAs.
- •Prototype the most critical methods.
- •Map stakeholders: ministries, national companies, regulators, investors.
- •Trace each method to a planning objective.
Phase 2: Build and Integrate
- •Turn the methods into functional requirements.
- •Configure the computational core.
- •Build and integrate the horizontal and vertical IDAs.
- •Connect existing data sources; test and document.
Phase 3: First National Plan and Transfer
- •Produce the base case, the opportunity map and a first portfolio of investment options, together with the country’s own planning team.
- •Validate against previous methods.
- •Train each role.
- •Leave a support and evolution plan.
10.3 A Living National Asset
After the first plan, the iDSS keeps working: new projects become new IDAs, existing ones are updated as assets age and data improves, and each planning cycle starts from the last one. Where the institution prefers, Knar can host and operate the model as a managed service.
Part 11: Conclusion
A national oil company, a national mining company, an energy or mining ministry, or a government allocating the country’s wealth carries a responsibility that spans generations. Decisions of that weight should rest on models that tell the truth about the system, not on spreadsheets and the pressures of the moment.
11.1 Why National Companies and Governments Must Decide This Way
- 1
The value is too large to leave to averages. Resources that take more than a decade to develop, and infrastructure that lasts for generations, cannot be judged on a single expected case.
- 2
Minerals, water and energy are one system. A mine is an energy and water sink; hydro shares water with cities and farms; exports compete with domestic supply. Planning them apart guarantees conflicts no one sees until they happen.
- 3
Capital follows clarity. Investors finance what they can price. Viability thresholds and downside ranges turn a promising resource into a bankable project.
- 4
Bad years decide outcomes. Droughts, price collapses and failures do not happen on average. A plan that survives only the expected case is not a plan.
- 5
Every investment affects the whole country. Only a model that measures every region and project shows side effects, shared value and the right sequence of investment.
- 6
Time lost cannot be recovered. Each year a viable project waits for an unplanned line, an unsecured water supply or an unbankable financing case is value the country loses for good.
- 7
Decisions must be defensible. A traceable model lets a minister, a board or a lender see why a decision was made, and protects national strategy from the intrigues of the moment.
- 8
Capability stays in the country. The iDSS is a living national asset, operated by the country’s own planners, improved each cycle, and independent of who holds office.
Countries that develop their resources well will not be those with the most resources, but those that see them most truly.